January
On New Years Eve I was reminded of the Y2K issue that arose to prominence in 1999. There were some who thought society would collapse as computers that processed year values of dates would stop working. In the end though there were isolated problems but on the whole the cross over to January 1, 2001 went without incident.
This leads me on to how SAS stores the date and time values within a dataset. This is different to the format for a variable that sets the display format for the date/time.
SAS dates are stored as the number of days from January 1, 1960 and account for all leap year days, including the leap year day in the year 2000.
SAS times count the number of seconds since midnight.
SAS datetimes are calculated as the number of seconds from midnight on January 1, 1960.
February
I recently had a client come to me and say that a program that was being run was producing the same results in a permanent dataset despite the fact that both the data and the program had changed. In the end it was an error in the SAS program and because the error was before the time when the permanent dataset was being created, SAS stopped processing and the new dataset was not being created - the old dataset still existed.
To make sure that your program is actually creating a new permanent dataset it is useful to either delete, or sometimes create a backup copy, of the dataset at the beginning of the program. This useful as if the new expected permanent dataset does not exist after the program run then an error of some kind occurred. To delete or rename a SAS dataset, use the DATASETS procedure, using the following syntax:
    PROC DATASETS LIBRARY=library_name;
        DELETE SAS-file;  ** Delete a dataset;
        RENAME old-name=new-name;  ** Rename a dataset;
        QUIT;
    RUN;
As an example, the dataset DEMO will be deleted from the library NEW:
    PROC DATASETS LIBRARY=new;
        DELETE demo;
        QUIT;
    RUN;
The other note I would like to remind ALL SAS programmers, ALWAYS check the SAS Log file, especially for any ERROR and WARNING messages.
March
April sees the start of the main SAS Conference Season. The three main SAS User conferences this year are:
- April 10-13, 2005, SAS Users Group International (SUGI) 30, Philadelphia, Pennsylvania, USA
- May 22-25, 2005, Pharmaceutical SAS Users Group (PharmaSUG), Phoenix, Arizona
- June 21-23, 2005, SAS Forum International (formerly SEUGI), Lisbon, Portugal
Why goto one? There are three good reasons for going. First you get to meet other people who are interested in working with SAS and sharing what they do with the product. The second is that you meet representatives from SAS who showcase the latest software products and their thinking of the future. And third is that you can actually meet the people who write the code behind SAS.
If you cannot be there in Philadelphia or Lisbon in person remember that you can see the highlights via the SAS website. There are also the following regional conferences in the US:
- September 11-14, 2005, NorthEast SAS Users Group (NESUG), Portland, Maine
- September 21-23, 2005, Western Users of SAS Software (WUSS), San Jose, California
- October 9-11, 2005, MidWest SAS Users Group (MWSUG), Cincinnati, Ohio
- October 16-18, 2005, South-Central SAS Users Group (SCSUG), San Antonio, Texas
- October 23-25, 2005, SouthEast SAS Users Group (SESUG), Portsmouth, Virginia
- November 6-8, 2005, Pacific Northwest SAS Users Group (PNWSUG), Tacoma, Washington
As well as these conferences there are a large number of local SAS User Groups throughout the world, from New Zealand to Norway, Brazil to Canada, who have their own meetings and support networks - you can find their contact information from SAS via the SAS web site or by contacting SAS direct.
Please support your local SAS User Group.
April
Finding that you have multiple records for a customer when you only expect a single record is frustrating. Below is an example of a piece of SAS code that will print those customers where your dataset has multiple records:
    proc sort data=salesdb;
        by custid;
    run;
    data multiple;
        set salesdb;
        by custid;
        if sum(first.custid,last.custid)^=2 then output;
    run;
    title1 "Mulitple Record Report from Sales Database";
    proc print data=multiple;
        by custid;
    run;
May
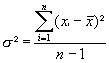
I recently received an email from Michael in Switzerland asking me if I could help explain why he was getting differences when comparing the variance results between SAS and Excel using the same set of numbers.
Traditionally the variance is calculated as
 (a)
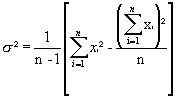
Alternately the equation can be written as
 (b)
The first equation (a) requires two passes of the data - the first pass to calculate the mean and the second to calculate the variance.
This second equation (b) is more commonly known as the Desktop Calculator Formula as it is possible to calculate the variance with one pass of the data. There is one issue with this formula as if the numbers are big and the differences between the numbers are small an incorrect result will prevail. This is because computers and calculators store results as real numbers and some precision may be lost when storing the sum of the square values across a long list of numbers. As an example calculate the variance of 10,000,001, 10,000,003 and 10,000,005 - the answer is 4 but some calculators may produce an answer of 0.
Now what about SAS and Excel, what do they do. SAS uses the Traditional Formula. Microsoft used the Desktop Calculator Formula until Excel 2003 (for Windows) and Excel (for Mac) when it changed to use the Traditional Formula1. The Desktop Calculator Formula appears to have been used by Microsoft as it was faster than doing the Traditional Formula, the latter requiring two passes of the data.
Are there any calculations that will produce a result with one pass of data? The answer is yes. One formula is known as the Method of Provisional Means where

and
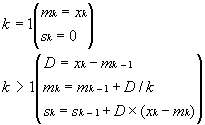
There are other methods that calculate the variance in one pass of the data but these are for later months.
I do hope this is useful. The moral of the story is to always check with your software documentation to see how statistics are being calculated.
--------------
1 Reference Microsoft Knowledgebase, article
828888, dated March 10, 2005
June
Being able to see what you data is helpful when analysing it. The most common procedure I find useful is the CHART procedure with the HBAR statement. Its use for continuous data, showing the extremes and distribution, can be seen in the following simple example:
The SAS Code
    proc chart data=wgtdata;
        hbar wtkg;
        title "Frequency Analysis of Weight (kg)";
    run;
The Output
                          Frequency Analysis of Weight (kg)

       Weight (kg)                                        Cum.              Cum.
    Midpoint                                        Freq  Freq  Percent  Percent
           |
     110   |******                                     6     6     6.00     6.00
           |
     130   |****************************              28    34    28.00    34.00
           |
     150   |**************************************    38    72    38.00    72.00
           |
     170   |*********************                     21    93    21.00    93.00
           |
     190   |****                                       4    97     4.00    97.00
           |
     210   |*                                          1    98     1.00    98.00
           |
     230   |*                                          1    99     1.00    99.00
           |
     250   |*                                          1   100     1.00   100.00
           |
           -----+----+----+----+----+----+----+---
                5    10   15   20   25   30   35

                          Frequency
As can be seen from the example the weights are mostly around the 140-160 range but there are a couple of values around the 220-260 I would confirm as they look extreme. It it likely that the values are correct but there is no harm in just checking.
July
Datasets can be deleted using the DATASETS procedure, but there is another procedure which is just as good but is no longer supported by SAS Technical Support but is still available in SAS (thanks SAS for keeping your software backward compatible) - it is called PROC DELETE, and will only work on SAS datasets, not catalogs or views.
The syntax for this procedure is:
PROC DELETE DATA=<libname.>dataset-1 <libname.>dataset-n;
If LIBNAME is not given then it is assumed that the dataset is in the WORK directory. Note that a list of datasets can be given, each one separated by a space.
There also is one special way I like using it, and it is with the dataset name _ALL_ -- this removes all datasets within a directory. The following example shows its use:
   PROC DELETE DATA=derived.ae work._ALL_;
   RUN;
August
When writing SAS code it is often useful to check the values that have been assigned to macro variables. A quick way to do this is to look at a SAS view called SASHELP.VMACRO.
From SAS version 8.2 and onwards it is possible to delete an assigned macro variable from the view by using the statement %SYMDEL.
September
There are many ways within SAS to get the last word in a character variable but my old favorite is still to start from the beginning and scan across the variable finding the position of the last word and then grabbing that word and saving it in a variable. The following example illustrates the method:
The SAS Code
    data _null_;
        infile cards;
        input name $ 1-15;
        length surname $15;
        i=1;
        do while(scan(name,i) ne "");
            i+1;
        end;
        surname=scan(name,i-1);
        put @1 name= @25 surname=;
    cards;
    Alfred Domett
    William Fox
    Edward Stafford
    William Fox
    Henry Sewell
    ;
    run;
The Output to the Log
    name=Alfred Domett      surname=Domett
    name=William Fox        surname=Fox
    name=Edward Stafford    surname=Stafford
    name=William Fox        surname=Fox
    name=Henry Sewell       surname=Sewell
There are other methods, including ones that start at the end, but this one is something I carry in my toolbox.
I get asked from time to time if there is a similar routine for Microsoft Excel. There is no inbuilt function for this but here is some VBA code that I use to create a function that when called will do the job:
    Function LastWord(String_Text As String)
    Dim HaveGotIt As String
    i = 1
    Do Until HaveGotIt Like (" *")
        HaveGotIt = Right(String_Text, i)
        i = i + 1
    Loop
    LastWord = Trim(HaveGotIt)
    End Function
I do hope you find this tip useful.
October
The COMPARE function compares two strings and notes the position of the first character (left to right) where it finds a difference – if no difference is found then a zero will result. The following example shows its use:
   167 data _null_;
   168 length flag1 flag2 $80;
   169 string1='THE COW JUMPED OVER THE MOON';
   170 string2='THE COW JUMPED OVER THE MOON';
   171 string3='THE COW JUMPED OVER THE BLUE MOON';
   172 compare1=compare(string1,string2);
   173 compare2=compare(string1,string3);
   174 if compare1>0 then
   175 flag1='String 1 and String 2 different starting at position '
   176 ||put(compare1,2.);
   177 else flag1='String 1 and String 2 same';
   178 if compare2>0 then
   179 flag2='String 1 and String 3 different starting at position '
   180 ||put(compare2,2.);
   181 else flag2='String 1 and String 3 same';
   182 put string1= /
   183 string2= /
   184 flag1= //
   185 string1= /
   186 string3= /
   187 flag2=;
   188 run;

   string1=THE COW JUMPED OVER THE MOON
   string2=THE COW JUMPED OVER THE MOON
   flag1=String 1 and String 2 same

   string1=THE COW JUMPED OVER THE MOON
   string3=THE COW JUMPED OVER THE BLUE MOON
   flag2=String 1 and String 3 different starting at position 25
November
The DIM function returns the number of elements in an array. I find this particulary useful when I am filling a series of variables with a value based on a condition. The following example looks at the variables SEX, RACE and AGE and places a value of 999 in the variable if it is missing:
   array dmvars{3} sex race age;
   do i=1 to dim(dmvars);
      if missing(dmvars(i)) then dmvars(i)=999;
   end;
This is easier than writing:
   if missing(sex) then sex=999;
   if missing(race) then race=999;
   if missing(age) then age=999;
I hope you find this tip useful.
December
To check the syntax of a data step or procedure without actually running the code, use the RUN statement with the CANCEL option at the end of the data step or procedure. The following code illustrates its use:
    proc sort data=climate0;
        by year country co2_prod;
    run cancel;
All the best for the holidays and hope everyone has a happy 2006.